
Compression quality, proven by real tests
Same image, smaller file, no visible quality loss. Drag the slider below and see for yourself.
Drag to see the real result
Original on the left, compressed on the right. Drag the divider or use the arrow keys — if you can spot a difference, we haven't done our job.
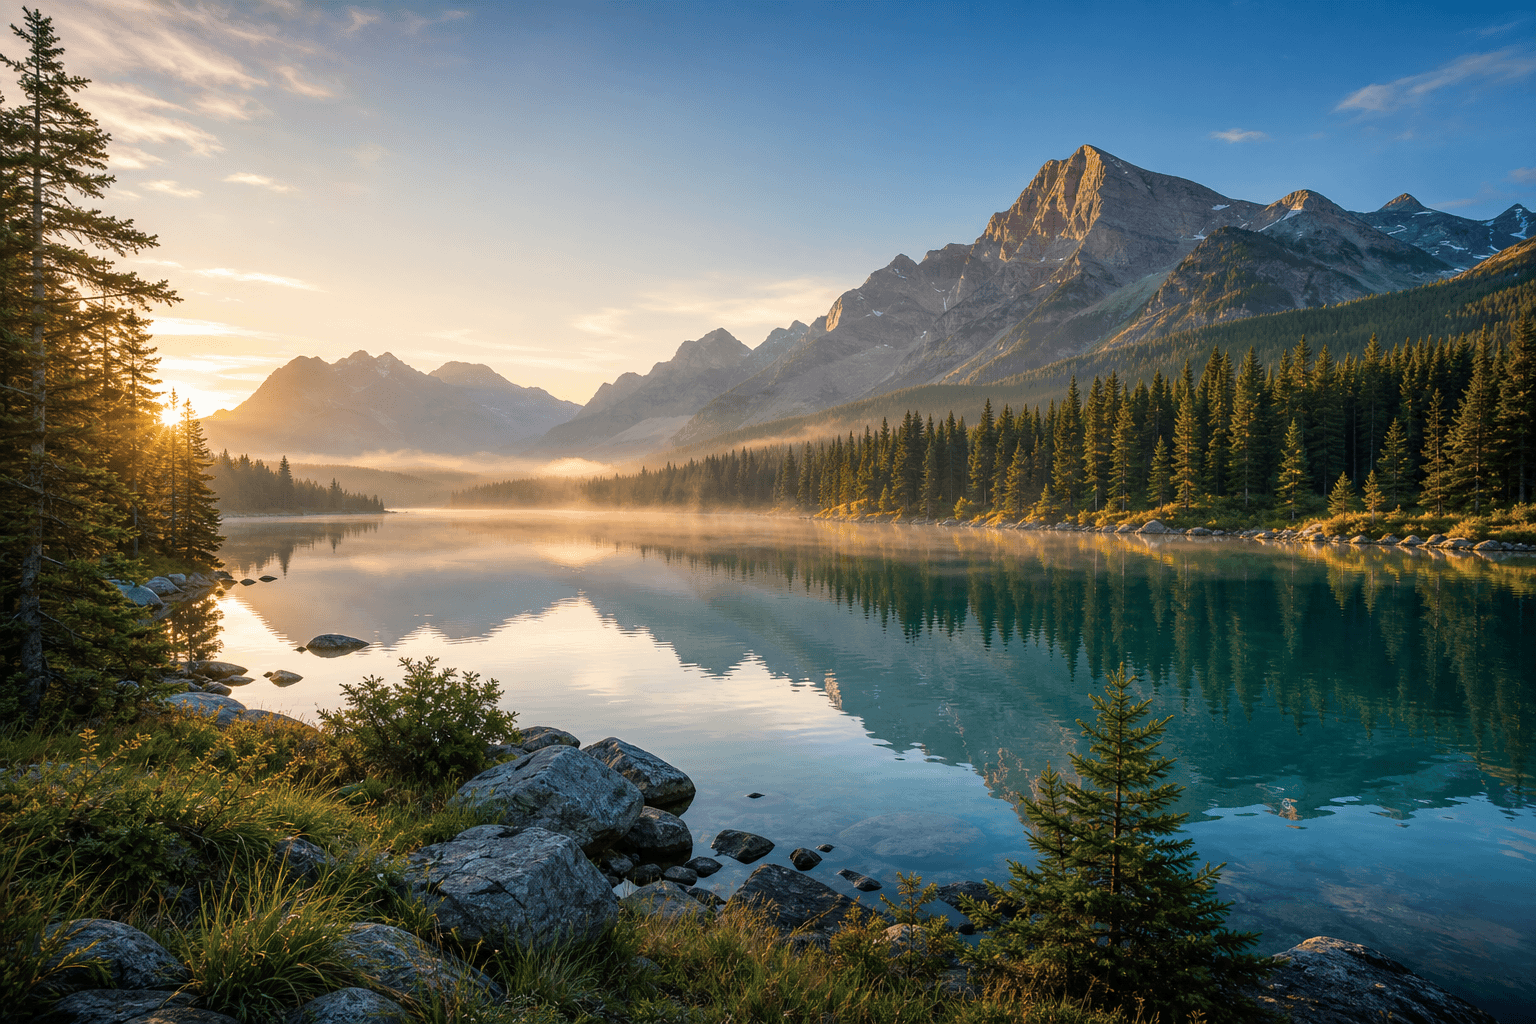 Original 2.6 MBCompressed 654 KBsaved 75.6%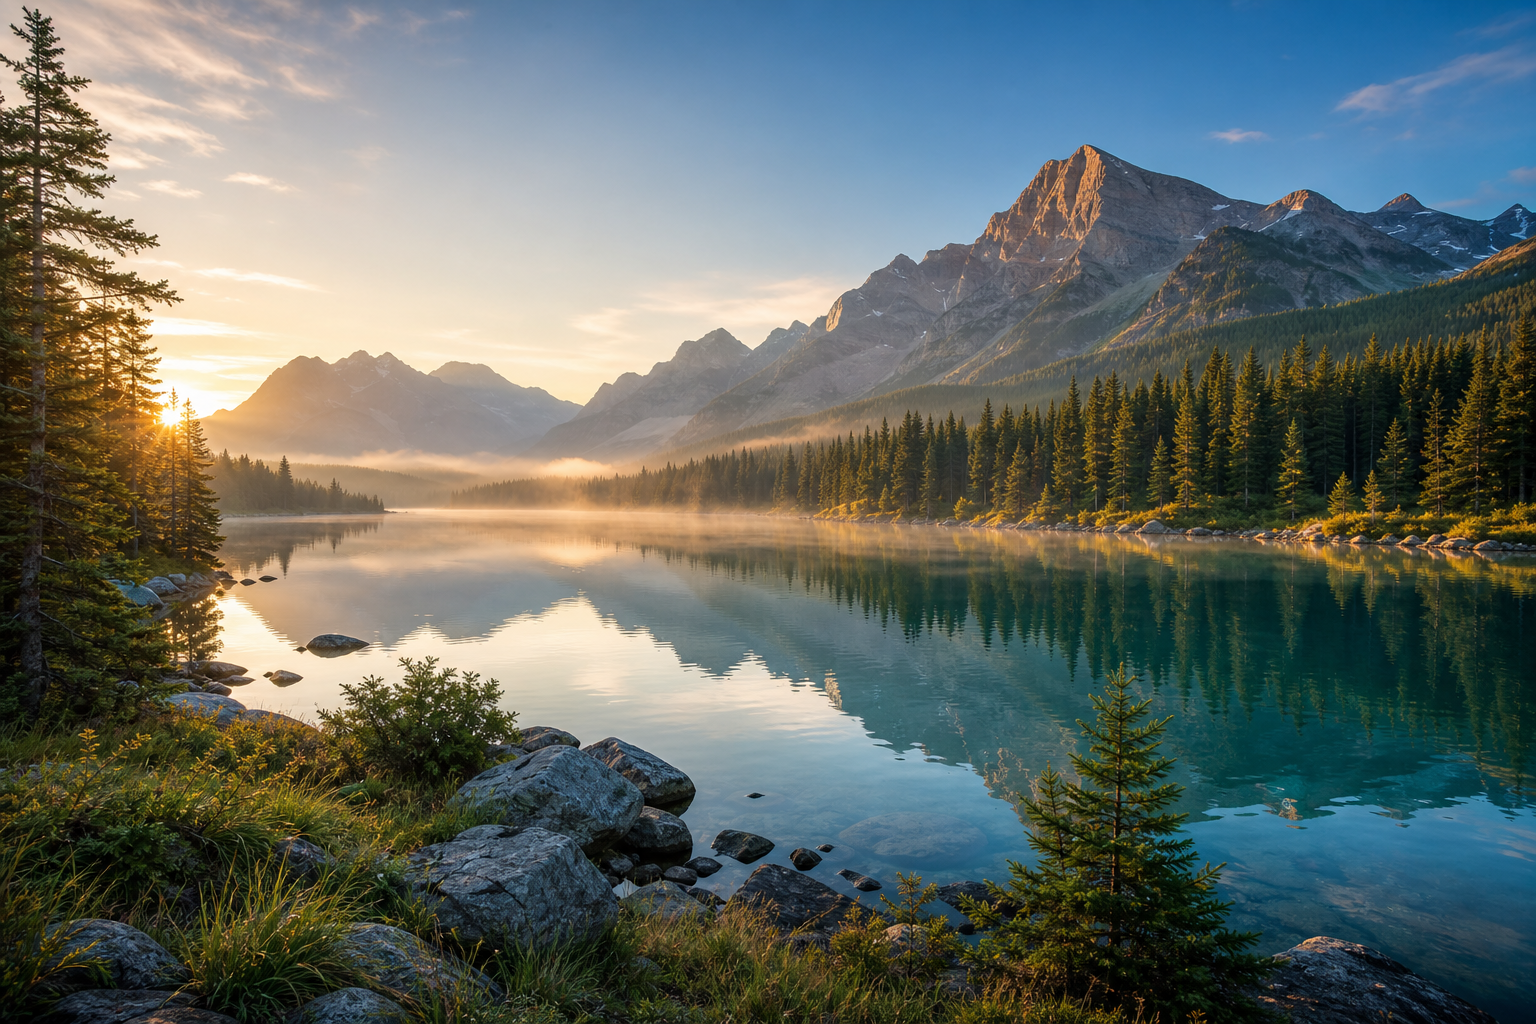
Samples are real engine output — download the original and compressed files to verify byte for byte. Samples and figures are refreshed together with each benchmark run.
Switch samples · gradients, transparency, illustration, photos and demanding textures, including hard-to-compress cases — no cherry-picking
PNG size vs. reference stack: for flat images / UI / icons / illustrations, our size at equal quality is about 75% of the reference; for photos and hard cases it is on par — PNG's size advantage is mainly on flat images. For the overall equal-quality comparison, see the JPEG section below (about 93%).
JPEG: same quality, smaller size
We compress each image to the same perceptual level as the reference stack — both SSIM and banding pass — and only then compare size.
On the equal-quality line, we compare size only
Passed- Landscape / photos: about 80%. Roughly 20% smaller than the reference — a real win.
- Textured / high-frequency: about 100%, essentially on par. At equal quality it matches the reference — no inflated smaller-than claim.
- One shared equal-quality line. Both sides are compressed until SSIM and banding pass, then we compare size — no raw-reduction-rate padding.
How to read this: we report size only at equal quality, not a raw reduction rate. Already-compressed JPEGs have little headroom left. Figures come from a reproducible duel report you can download and check image by image; per-category numbers publish with the next benchmark refresh.
Numbers you can verify yourself
No marketing charts. The benchmark runs automatically on every release — the report is downloadable, the command is reproducible, and the environment is fully disclosed.
Methodology
The test set spans gradients, transparency, illustration, photos and demanding textures, with source and license recorded per image. The control group runs a best-in-class open-source stack under the same quality constraints; an image counts as a win only when it passes on both size and quality.
- 1Size metric: output bytes under the same quality constraint (smaller is better ↓)
- 2Perceptual metric: color-sensitive SSIM (higher is better ↑), plus banding and chroma ΔE checks
- 3Samples show a licensed subset; download original and compressed files for each to verify
Raw data
Download the latest report and check every size and quality figure image by image.
Reproduce it yourself
Run the full benchmark suite locally against the same control stack:
node bench/run.mjsEnvironment: Apple M410×Darwin 25.4.0 arm64Node v22.21.0sharp 0.35.0imagequant 2.4.1